Pulled this tiny one out of the mud and brought it home

Pulled this tiny one out of the mud and brought it home

You’ll need MS SQL 2005 or above, it looks like version 2012 has it built in see here!
This is my first use of the OVER bit so it may be a little ugly, also I have been using the old way to pivot stuff so it’s a bit messy at the end.
declare @t table (percentile numeric(10,5))
insert into @t values (0)
insert into @t values (0.25)
insert into @t values (0.5)
insert into @t values (0.75)
insert into @t values (0.8)
insert into @t values (1.0)

--give rownumbers for your data over a partition
drop table ##mgw
SELECT
	s.gppraccode
	,age
	,ROW_NUMBER() OVER (partition by gppraccode ORDER BY age) AS "RowNumber"
INTO ##mgw
FROM mgw_ane_base AS s

--calculate the individual values per percentile
drop table ##mgw_percentileHolding
select	t.percentile*(max(rownumber)-1)+1 as act
		,floor(t.percentile*(max(rownumber)-1)+1) as K
		,((t.percentile*(max(rownumber)-1)+1) % 1) as D
		,count(*) as N
		,t.percentile
		,a.gppraccode
into ##mgw_percentileHolding
from ##mgw as a join @t as t on 1=1
group by t.percentile,a.gppraccode

--fold it all over in a manual-ish pivot
select
	gppraccode
	,max(case when percentile=0 then PercentileValue end) as [0%]
	,max(case when percentile=0.25 then PercentileValue end) as [25%]
	,max(case when percentile=0.5 then PercentileValue end) as [50%]
	,max(case when percentile=0.75 then PercentileValue end) as [75%]
	,max(case when percentile=0.8 then PercentileValue end) as [80%]
	,max(case when percentile=1 then PercentileValue end) as [100%]
	,N
FROM
	(
	SELECT
	*
	,(SELECT max(age) from ##mgw as b where b.rownumber<=a.act and a.gppraccode=b.gppraccode) as below
	,(SELECT min(age) from ##mgw as b where b.rownumber>=a.act  and a.gppraccode=b.gppraccode) as above
	,(SELECT min(age) from ##mgw as b where b.rownumber>=a.act  and a.gppraccode=b.gppraccode)-(select max(age) from ##mgw as b where b.rownumber<=a.act and a.gppraccode=b.gppraccode ) as f
	,case	when percentile=0 then (SELECT min(age) from ##mgw as b where a.gppraccode=b.gppraccode)
			when percentile=1 then (SELECT max(age) from ##mgw as b where a.gppraccode=b.gppraccode)
			else (SELECT max(age) from ##mgw as b where b.rownumber<=a.act and a.gppraccode=b.gppraccode)+D*((select min(age) from ##mgw as b where b.rownumber>=a.act and a.gppraccode=b.gppraccode)-(select max(age) from ##mgw as b where b.rownumber<=a.act and a.gppraccode=b.gppraccode)) end as PercentileValue
	FROM ##mgw_percentileHolding as a
) as internal
group by gppraccode,N
You need SQL 2005 or greater for this:
Rownumbers with partitions:
SELECT
    s.gppraccode
    ,age
    ,ROW_NUMBER()OVER (PARTITION BY gppraccode ORDER BY age asc) As [RowNumber]
FROM mgw_ane_base AS s
SELECT s.gppraccode, age
    ,ROW_NUMBER() OVER (ORDER BY age) AS "RowNumber"
    ,RANK() OVER (ORDER BY age) AS Rank
    ,DENSE_RANK() OVER (ORDER BY age) AS "DenseRank"
    ,NTILE(10) OVER (ORDER BY age) AS Quartile
INTO ##mgw
FROM mgw_ane_base AS s
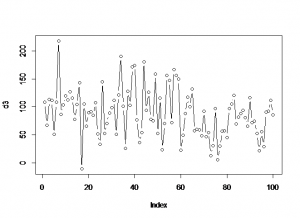
Generate a set of data where the distribution parameters change part way through:
d1<-rnorm(n,mean,sd)
d1<-rnorm(65,98,45)
d2<-rnorm(35,67,35)
d3<-c(d1,d2)
plot(d3,type="b")

The following table gives the distribution and the command for generating n data from each distribution.
| Gaussian | rnorm(n, mean=0, sd=1) |
| Exponential | rexp(n, rate=1) |
| Gamma | rgamma(n, shape, scale=1) |
| Poisson | rpois(n, lambda) |
| Weibull | rweibull(n, shape, scale=1) |
| Cauchy | rcauchy(n, location=0, scale=1) |
| Beta | rbeta(n, shape1, shape2) |
| 'Student' (T) | rt(n, df) |
| Fisher-Snedecor (F) | rf(n, df1, df2) |
| Pearson (Chi-squared) | rchisq(n, df) |
| Binomial | rbinom(n, size, prob) |
| Multinomial | rmultinom(n, size, prob) |
| Geometric | rgeom(n, prob) |
| Hypergeometric | rhyper(nn, m, n, k) |
| Logistic | rlogis(n, location=0, scale=1) |
| Lognormal | rlnorm(n, meanlog=0, sdlog=1) |
| Negative Binomial | rnbinom(n, size, prob) |
| Uniform | runif(n, min=0, max=1) |
| Wilcoxon's statistics | rwilcox(nn, m, n), rsignrank(nn, n) |
Hi MonkeyMike,
We have received a request to permanently delete your account. Your account has been deactivated from the site and will be permanently deleted within 14 days.
If you did not request to permanently delete your account, please login to Facebook to cancel this request:
http://www.facebook.com/login.php
Thanks,
The Facebook Team
So how do you tell what dimension is associated with a measure?
Open up BIDS (SQL Server Business Intelligence Development Studio)
From the file menu select: Open > Analysis Service Database
and choose your databsae and server etc.
Let the old girl sort itself out and then in the Solution Explorer select your cube of interest.

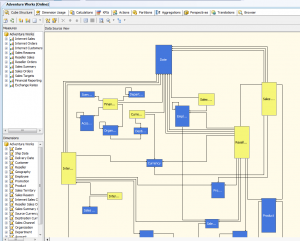
You’ll get something like this interlinked view:

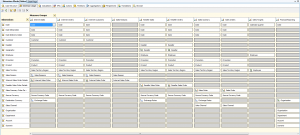
Just switch to the Dimension Usage tab:

and you can see that Department is NOT linked to most measures.
WITH
SET [a] AS [Product].[Category].Levels(1).Members
SET [b] AS [Date].[Calendar].Levels(1).Members
SELECT
     Order([a], [b].Item(0), BDESC ) ON ROWS
     ,[b]  ON COLUMNS
FROM [Adventure Works];
The “Category” above is not an MDX keyword, but a part of the hierarchy under the “product” dimension.
What happens if you change the dimension to one in which the measure does not spread over?
WITH
SET [a] AS [Product].[Category].Levels(1).Members
SET [b] AS [Date].[Calendar].Levels(1).Members
SELECT
     Order([a], [b].Item(0), BDESC ) ON ROWS
     ,[b]  ON COLUMNS
FROM [Adventure Works];
Which gives:
| CY 2001 | CY 2002 | CY 2003 | CY 2004 | CY 2006 | |
| Bikes | $7,395,348.63 | $19,956,014.67 | $25,551,775.07 | $13,399,243.18 | (null) |
| Components | $615,474.98 | $3,610,092.47 | $5,482,497.29 | $2,091,011.92 | (null) |
| Clothing | $34,376.34 | $485,587.15 | $871,864.19 | $386,013.16 | (null) |
| Accessories | $20,235.36 | $92,735.35 | $296,532.88 | $161,794.33 | (null) |
Now what do we get if we only look at the top level of the row dimenion?
WITH
SET [a] AS [Product].[Category].Levels(0).Members
SET [b] AS [Date].[Calendar].Levels(1).Members
SELECT
     Order([a], [b].Item(0), BDESC ) ON ROWS
     ,[b]  ON COLUMNS
FROM [Adventure Works];
| CY 2001 | CY 2002 | CY 2003 | CY 2004 | CY 2006 | |
| All Products | $8,065,435.31 | $24,144,429.65 | $32,202,669.43 | $16,038,062.60 | (null) |
Which is just the total “whatever measure this is” for the column dimension.
Now let’s throw in a dimension which doesn’t split the measure.
WITH
SET [a] AS [Department].Levels(1).Members
SET [b] AS [Date].[Calendar].Levels(1).Members
SELECT
     Order([a], [b].Item(0), BDESC ) ON ROWS
     ,[b]  ON COLUMNS
FROM [Adventure Works];
you get this:
| CY 2001 | CY 2002 | CY 2003 | CY 2004 | CY 2006 | |
| Executive General and Administration | $8,065,435.31 | $24,144,429.65 | $32,202,669.43 | $16,038,062.60 | (null) |
| Inventory Management | $8,065,435.31 | $24,144,429.65 | $32,202,669.43 | $16,038,062.60 | (null) |
| Manufacturing | $8,065,435.31 | $24,144,429.65 | $32,202,669.43 | $16,038,062.60 | (null) |
| Quality Assurance | $8,065,435.31 | $24,144,429.65 | $32,202,669.43 | $16,038,062.60 | (null) |
| Research and Development | $8,065,435.31 | $24,144,429.65 | $32,202,669.43 | $16,038,062.60 | (null) |
| Sales and Marketing | $8,065,435.31 | $24,144,429.65 | $32,202,669.43 | $16,038,062.60 | (null) |
Which looks like a cartesian join enacted on a crosstab. So each example of the row dimention gets an instance of the column dimensions (which the measure is applicable to)
How do I find out how my measures and dimensions are related?
…for that you need BIDS.
WITH
SET [a] AS [Product].[Subcategory].Levels(1).Members
SET [b] AS [Date].[Calendar].Levels(1).Members
SELECT
     Order([a],[b].Item(0), BDESC ) ON ROWS,
     Order([b],[a].Item(0), BDESC  ) ON COLUMNS
FROM [Adventure Works] ;
works the same as:
WITH
SET [RowSet]    AS [Product].[Subcategory].Levels(1).Members
SET [ColumnSet] AS [Date].[Calendar].Levels(1).Members
SELECT
     Order( [RowSet], [ColumnSet].Item(0), BDESC ) ON ROWS,
     Order([ColumnSet],[RowSet].Item(0), BDESC  ) ON COLUMNS
FROM [Adventure Works];