some more MDX

Some fairly basic MDX stuff:

WITH
SET [a] AS [Geography].[City].[City] * [Product].[Category].Levels(1).Members 
SET [b] AS [Date].[Calendar].Levels(1).Members * [Sales Territory].[Sales Territory].[Country]
SELECT
     Order([a], [b].Item(0), BDESC ) ON ROWS
     ,[b]  ON COLUMNS
FROM [Adventure Works];

Use the * (asterisk) to separate multiple columns and rows. It’s a bit like a similar use in R when plotting against two things, I think the library(doBy) uses the same .

…with selection and NON EMPTY:

WITH
SET [a] AS	[Geography].[Country].&[Germany]
			*[Product].[Category].Levels(1).Members 
SET [b] AS	[Date].[Calendar].Levels(1).Members
			* [Sales Territory].[Sales Territory].[Country]
SELECT
     Order([a], [b].Item(0), BDESC ) ON ROWS
     ,non empty{[b]}  ON COLUMNS--[Geography].[City].&[Abingdon]&[ENG]
FROM [Adventure Works];
Calculate Percentiles with MS-SQL 2005 using interpolation…

You’ll need MS SQL 2005 or above, it looks like version 2012 has it built in see here!
This is my first use of the OVER bit so it may be a little ugly, also I have been using the old way to pivot stuff so it’s a bit messy at the end.

declare @t table (percentile numeric(10,5))
insert into @t values (0)
insert into @t values (0.25)
insert into @t values (0.5)
insert into @t values (0.75)
insert into @t values (0.8)
insert into @t values (1.0)

--give rownumbers for your data over a partition
drop table ##mgw
SELECT 
	s.gppraccode
	,age
	,ROW_NUMBER() OVER (partition by gppraccode ORDER BY age) AS "RowNumber"
INTO ##mgw
FROM mgw_ane_base AS s 

--calculate the individual values per percentile
drop table ##mgw_percentileHolding
select	t.percentile*(max(rownumber)-1)+1 as act
		,floor(t.percentile*(max(rownumber)-1)+1) as K
		,((t.percentile*(max(rownumber)-1)+1) % 1) as D
		,count(*) as N
		,t.percentile
		,a.gppraccode
into ##mgw_percentileHolding
from ##mgw as a join @t as t on 1=1
group by t.percentile,a.gppraccode

--fold it all over in a manual-ish pivot
select 
	gppraccode
	,max(case when percentile=0 then PercentileValue end) as [0%]
	,max(case when percentile=0.25 then PercentileValue end) as [25%]
	,max(case when percentile=0.5 then PercentileValue end) as [50%]
	,max(case when percentile=0.75 then PercentileValue end) as [75%]
	,max(case when percentile=0.8 then PercentileValue end) as [80%]
	,max(case when percentile=1 then PercentileValue end) as [100%]
	,N
FROM
	(
	SELECT 
	*
	,(SELECT max(age) from ##mgw as b where b.rownumber<=a.act and a.gppraccode=b.gppraccode) as below
	,(SELECT min(age) from ##mgw as b where b.rownumber>=a.act  and a.gppraccode=b.gppraccode) as above
	,(SELECT min(age) from ##mgw as b where b.rownumber>=a.act  and a.gppraccode=b.gppraccode)-(select max(age) from ##mgw as b where b.rownumber<=a.act and a.gppraccode=b.gppraccode ) as f
	,case	when percentile=0 then (SELECT min(age) from ##mgw as b where a.gppraccode=b.gppraccode) 
			when percentile=1 then (SELECT max(age) from ##mgw as b where a.gppraccode=b.gppraccode)  
			else (SELECT max(age) from ##mgw as b where b.rownumber<=a.act and a.gppraccode=b.gppraccode)+D*((select min(age) from ##mgw as b where b.rownumber>=a.act and a.gppraccode=b.gppraccode)-(select max(age) from ##mgw as b where b.rownumber<=a.act and a.gppraccode=b.gppraccode)) end as PercentileValue
	FROM ##mgw_percentileHolding as a
) as internal
group by gppraccode,N

Row_number(), dense Rank rank etc

You need SQL 2005 or greater for this:
Rownumbers with partitions:

SELECT 
    s.gppraccode
    ,age
    ,ROW_NUMBER()OVER (PARTITION BY gppraccode ORDER BY age asc) As [RowNumber]
FROM mgw_ane_base AS s 
SELECT s.gppraccode, age
    ,ROW_NUMBER() OVER (ORDER BY age) AS "RowNumber"
    ,RANK() OVER (ORDER BY age) AS Rank
    ,DENSE_RANK() OVER (ORDER BY age) AS "DenseRank"
    ,NTILE(10) OVER (ORDER BY age) AS Quartile
INTO ##mgw
FROM mgw_ane_base AS s 

Generate Random data in R

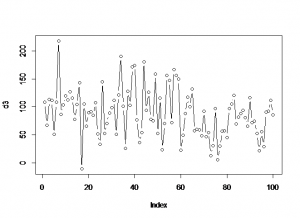
Generate a set of data where the distribution parameters change part way through:

d1<-rnorm(n,mean,sd)
d1<-rnorm(65,98,45)
d2<-rnorm(35,67,35)
d3<-c(d1,d2)
plot(d3,type="b")


The following table gives the distribution and the command for generating n data from each distribution.

Gaussian rnorm(n, mean=0, sd=1)
Exponential rexp(n, rate=1)
Gamma rgamma(n, shape, scale=1)
Poisson rpois(n, lambda)
Weibull rweibull(n, shape, scale=1)
Cauchy rcauchy(n, location=0, scale=1)
Beta rbeta(n, shape1, shape2)
'Student' (T) rt(n, df)
Fisher-Snedecor (F) rf(n, df1, df2)
Pearson (Chi-squared) rchisq(n, df)
Binomial rbinom(n, size, prob)
Multinomial rmultinom(n, size, prob)
Geometric rgeom(n, prob)
Hypergeometric rhyper(nn, m, n, k)
Logistic rlogis(n, location=0, scale=1)
Lognormal rlnorm(n, meanlog=0, sdlog=1)
Negative Binomial rnbinom(n, size, prob)
Uniform runif(n, min=0, max=1)
Wilcoxon's statistics rwilcox(nn, m, n), rsignrank(nn, n)

Simple MDX again

WITH
SET [a] AS [Product].[Category].Levels(1).Members
SET [b] AS [Date].[Calendar].Levels(1).Members
SELECT
     Order([a], [b].Item(0), BDESC ) ON ROWS
     ,[b]  ON COLUMNS
FROM [Adventure Works];

The “Category” above is not an MDX keyword, but a part of the hierarchy under the “product” dimension.


What happens if you change the dimension to one in which the measure does not spread over?

WITH
SET [a] AS [Product].[Category].Levels(1).Members
SET [b] AS [Date].[Calendar].Levels(1).Members
SELECT
     Order([a], [b].Item(0), BDESC ) ON ROWS
     ,[b]  ON COLUMNS
FROM [Adventure Works];

Which gives:

CY 2001 CY 2002 CY 2003 CY 2004 CY 2006
Bikes $7,395,348.63 $19,956,014.67 $25,551,775.07 $13,399,243.18 (null)
Components $615,474.98 $3,610,092.47 $5,482,497.29 $2,091,011.92 (null)
Clothing $34,376.34 $485,587.15 $871,864.19 $386,013.16 (null)
Accessories $20,235.36 $92,735.35 $296,532.88 $161,794.33 (null)

Now what do we get if we only look at the top level of the row dimenion?

WITH
SET [a] AS [Product].[Category].Levels(0).Members
SET [b] AS [Date].[Calendar].Levels(1).Members
SELECT
     Order([a], [b].Item(0), BDESC ) ON ROWS
     ,[b]  ON COLUMNS
FROM [Adventure Works];
CY 2001 CY 2002 CY 2003 CY 2004 CY 2006
All Products $8,065,435.31 $24,144,429.65 $32,202,669.43 $16,038,062.60 (null)

Which is just the total “whatever measure this is” for the column dimension.
Now let’s throw in a dimension which doesn’t split the measure.

WITH
SET [a] AS [Department].Levels(1).Members
SET [b] AS [Date].[Calendar].Levels(1).Members
SELECT
     Order([a], [b].Item(0), BDESC ) ON ROWS
     ,[b]  ON COLUMNS
FROM [Adventure Works];

you get this:

CY 2001 CY 2002 CY 2003 CY 2004 CY 2006
Executive General and Administration $8,065,435.31 $24,144,429.65 $32,202,669.43 $16,038,062.60 (null)
Inventory Management $8,065,435.31 $24,144,429.65 $32,202,669.43 $16,038,062.60 (null)
Manufacturing $8,065,435.31 $24,144,429.65 $32,202,669.43 $16,038,062.60 (null)
Quality Assurance $8,065,435.31 $24,144,429.65 $32,202,669.43 $16,038,062.60 (null)
Research and Development $8,065,435.31 $24,144,429.65 $32,202,669.43 $16,038,062.60 (null)
Sales and Marketing $8,065,435.31 $24,144,429.65 $32,202,669.43 $16,038,062.60 (null)

Which looks like a cartesian join enacted on a crosstab. So each example of the row dimention gets an instance of the column dimensions (which the measure is applicable to)
How do I find out how my measures and dimensions are related?
…for that you need BIDS.

MDX again

WITH
SET [a] AS [Product].[Subcategory].Levels(1).Members
SET [b] AS [Date].[Calendar].Levels(1).Members
SELECT
     Order([a],[b].Item(0), BDESC ) ON ROWS,
     Order([b],[a].Item(0), BDESC  ) ON COLUMNS
FROM [Adventure Works] ;

works the same as:

WITH
SET [RowSet]    AS [Product].[Subcategory].Levels(1).Members
SET [ColumnSet] AS [Date].[Calendar].Levels(1).Members
SELECT
     Order( [RowSet], [ColumnSet].Item(0), BDESC ) ON ROWS,
     Order([ColumnSet],[RowSet].Item(0), BDESC  ) ON COLUMNS
FROM [Adventure Works];

A Simple MDX Example Using Adventure Works

WITH
SET [RowSet]    AS [Product].[Subcategory].Levels(1).Members
SET [ColumnSet] AS [Product].[Category].Levels(1).Members
SELECT
     Order( [RowSet], [ColumnSet].Item(0), BDESC ) ON ROWS,
     [ColumnSet]                                   ON COLUMNS
FROM [Adventure Works]

Output(truncated):

CY 2001 CY 2002 CY 2003 CY 2004 CY 2006
Mountain Bikes $4,545,336.51 $9,190,838.09 $8,854,263.03 $3,902,246.74 (null)
Road Bikes $2,850,012.12 $10,765,176.58 $11,294,381.37 $4,448,636.90 (null)
Mountain Frames $371,587.79 $1,400,331.68 $2,067,908.64 $873,844.03 (null)
Road Frames $243,887.19 $1,618,391.51 $1,631,377.27 $356,197.37 (null)
Jerseys $28,255.57 $110,243.77 $290,004.73 $150,804.63 (null)

If you change the value of

     Order( [RowSet], [ColumnSet].Item(0), BDESC )

to

     Order( [RowSet], [ColumnSet].Item(1), BDESC )

then the sorted column changes.
Also if you change the parameter of the Levels in the following section:

SET [RowSet]    AS [Product].[Subcategory].Levels(1).Members
SET [ColumnSet] AS [Date].[Calendar].Levels(1).Members

to

SET [RowSet]    AS [Product].[Subcategory].Levels(0).Members
SET [ColumnSet] AS [Date].[Calendar].Levels(0).Members

then this collapses down to a single number so depending on how many objects exist in the dimensions hierarchy you can use higher and higher numbers for the Levels to get more columns or rows (I think).

WITH
SET [RowSet]    AS [Product].[Subcategory].Levels(0).Members
SET [ColumnSet] AS [Date].[Calendar].Levels(1).Members
SELECT
     Order( [RowSet], [ColumnSet].Item(0), BDESC ) ON ROWS,
     Order([ColumnSet],[RowSet].Item(0), BDESC  ) ON COLUMNS
FROM [Adventure Works] ;

This now sorts by the values in the rows and columns the values used in the columns.

Rank & Miscellany

Rank things in the table…..very usefull for more complex stuff

SELECT
    --your select bits here
,(Select count(*)	FROM YOUR_TABLE_NAME as internal
WHERE internal.refrl_refno=external.refrl_refno
AND internal.start_dttm

Age groups...
Slot these into a CASE END Sandwich

When age between  0 and  4 then '00-04'
When age between  5 and  9 then '05-09'
When age between 10 and 14 then '10-14'
When age between 15 and 19 then '15-19'
When age between 20 and 24 then '20-24'
When age between 25 and 29 then '25-29'
When age between 30 and 34 then '30-34'
When age between 35 and 39 then '35-39'
When age between 40 and 44 then '40-44'
When age between 45 and 49 then '45-49'
When age between 50 and 54 then '50-54'
When age between 55 and 59 then '55-59'
When age between 60 and 64 then '60-64'
When age between 65 and 69 then '65-69'
When age between 70 and 74 then '70-74'
When age between 75 and 79 then '75-79'
When age between 80 and 84 then '80-84'
When age between 85 and 89 then '85-89'
When age between 90 and 94 then '90-94'
When age between 95 and 99 then '95-99'

Create a table variable...

DECLARE @sw  table
(
field_refno numeric
, var_field varchar(10)
)
INSERT INTO @sw VALUES(1,'Hudgle')

Using HAVING

SELECT
	count(prvsp_refno) as N
	, patnt_refno
FROM 	provider_spells
WHERE
	inmgt_refno=200870
	and admit_dttm > '2008-01-01'
GROUP BY patnt_refno
HAVING
	count(prvsp_refno)>10

SQL time-ish stuff

Extract the time:

--get the time as an hour
DATEPART(hh,getdate())
Extract the dayname:
--get the day as a word (short)
UPPER(left(datename(dw,getdate()),3))
--get something nicely formatted.
substring(convert(char,getdate() ,120),12,5)

Create a table full of sequential date_time

USE tempdb
DECLARE @t int
DECLARE @inc_date datetime 
SET @inc_date = '2001-01-01 23:59:59'  
--CHANGE THIS TIME TO GET DIFFERENT SNAPSHOT TIME first date and time of temp table 

--if the temp table exists drop and recreate with the date time supplied above	
IF  (SELECT '1' as exist_ WHERE exists (select '1' from sysobjects  WHERE  name='##Temp_dates')) = '1' 
	BEGIN DROP TABLE  ##Temp_dates END
--create the table
CREATE TABLE ##Temp_dates(t_date datetime NOT NULL PRIMARY KEY) 
	SET NOCOUNT ON  
WHILE @inc_date <= '2012-12-31' 
	BEGIN 
	INSERT ##Temp_dates (t_date) VALUES (@inc_date) 
	SET @inc_date = @inc_date + 1 --or decimal value for hours 0.5 etc..
	END

SQL Date Scriptlets….

Convert calendar month number to financial year month number i.e. April = 1 rather than 4
In the following DTTM = Your date field

(MONTH([DTTM])+8)%12+1

Obtain Financial year from a date.

CASE WHEN MONTH(DTTM) IN (1,2,3) THEN CONVERT(CHAR(4),YEAR(DTTM)-1)+'/'+CONVERT(CHAR(4),(YEAR(DTTM))) 
ELSE CONVERT(CHAR(4),YEAR(DTTM)) +'/'+CONVERT(CHAR(4),YEAR(DTTM)+1) END as fyear

Some Automatic Dates:

--first day of current month
DATEADD(MM, DATEDIFF(M, 0, GETDATE()), 0)  

--first day of previous months
DATEADD(MM, DATEDIFF(M, 0, GETDATE())-1 , 0)  

--last day of previous month
DATEADD(ms,-2,DATEADD(MM, DATEDIFF(M, 0, GETDATE()) , 0))  

--tomorrow evening
DATEADD(ms,-2,DATEADD(dd, DATEDIFF(d, 0, GETDATE())+2 , 0))  

…or swap the getdate() to a field to get the appropriate conversion from a field.

Select the first day of the current financial year…

case when month(DTTM) between 4 and 12 
then DATEADD(MM, DATEDIFF(M, 0, DTTM)-(month(DTTM)-4) , 0) 
else   DATEADD(MM, DATEDIFF(M, 0, DTTM)-(month(DTTM)+8) , 0) end