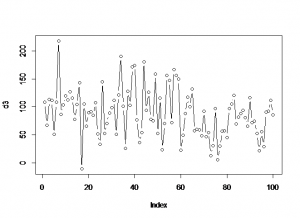
Generate a set of data where the distribution parameters change part way through:
d1<-rnorm(n,mean,sd)
d1<-rnorm(65,98,45)
d2<-rnorm(35,67,35)
d3<-c(d1,d2)
plot(d3,type="b")

The following table gives the distribution and the command for generating n data from each distribution.
| Gaussian | rnorm(n, mean=0, sd=1) |
| Exponential | rexp(n, rate=1) |
| Gamma | rgamma(n, shape, scale=1) |
| Poisson | rpois(n, lambda) |
| Weibull | rweibull(n, shape, scale=1) |
| Cauchy | rcauchy(n, location=0, scale=1) |
| Beta | rbeta(n, shape1, shape2) |
| 'Student' (T) | rt(n, df) |
| Fisher-Snedecor (F) | rf(n, df1, df2) |
| Pearson (Chi-squared) | rchisq(n, df) |
| Binomial | rbinom(n, size, prob) |
| Multinomial | rmultinom(n, size, prob) |
| Geometric | rgeom(n, prob) |
| Hypergeometric | rhyper(nn, m, n, k) |
| Logistic | rlogis(n, location=0, scale=1) |
| Lognormal | rlnorm(n, meanlog=0, sdlog=1) |
| Negative Binomial | rnbinom(n, size, prob) |
| Uniform | runif(n, min=0, max=1) |
| Wilcoxon's statistics | rwilcox(nn, m, n), rsignrank(nn, n) |
her name is eggmonroe…..she’s older.