Razor and c# etc.
Notes on my first stab at MVC on vs2010
@ are very important.
A good quick reference for those confused about the cshtml syntax:
http://haacked.com/archive/2011/01/06/razor-syntax-quick-reference.aspx/
Call a function from the page:
@( projectname.Controllers.SpecificController.FuntionName())
Basically fully qualify the name of the function and you should be fine.
You might have to declare the function as static.
http://www.w3schools.com/aspnet/showfile_c.asp?filename=try_webpages_cs_003
Help my VS2010 doesn’t work properly for the model section!!
“DBContext” Are you missing an assembly reference?
http://www.microsoft.com/en-gb/download/confirmation.aspx?id=1491 and include
using System.Data.Entity;
at the top of your source file/class whatever…
SSRS tricks: Web Sites
Recoding a factor
When you have N levels of a factor but you would like M (M < N) you need to recode the data set.
when you run str(df) you get an idea that factors are numbered in any vetor or data frame.
We need to use a command to recode the levels. The command you use is ‘levels’:
levels(df$factor)[c(2,4,6,7)] = "Horse Whispering"
Which means: Take levels that have the internal numberings of 2,4,6,7 and convert them to being “Horse Whispering”.
To recode the rest you need to find the internal numbering of the new levels for the df:
levels(df$factor)
because the levels that were formally 2,4,6 and 7 have now been recoded into a single value and you’ll have to adjust the integers that you are using every time you run the command.
Continue on until all the necessary coding has been completed.
To make sure you have recoded properly you should make a copy of the first factor and recode the copy rather than the original. That way you can compare new and old later:
table(df$OrigFactor , df$RecodedFactor)
Which will print out a table of counts for OrigFactor Vs RecodedFactor
ggplot2/qplot basics
Install and load the ggplot2 and Cairo libraries
install.packages(c("ggplot2","Cairo")
library(c(ggplot2,Cairo))
set up some data (or use some real data)
x1<-rnorm(150,mean = rep(1:3, each =50),sd = 0.7)
x2<-rnorm(150,mean = rep(c(1,2,1.5), each = 50),sd = 0.2)
x3<-rnorm(150,mean = rep(c(20,30,3),each = 50)), sd = 0.5)
n3<-rep(c("GRP 01","GRP 02","GRP 03"),each=50)
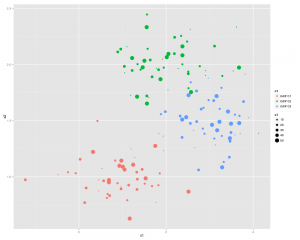
Here is the command to generate the PNG file, with anti-aliasing:
CairoPNG(filename = "Plot1.png", antialias="subpixel", width = 1000, height=800, units = "px")
{
  qplot(x1,x2, ,color = n3, size = x3)
}
dev.off()
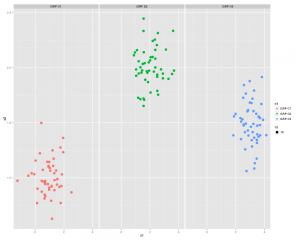
or you can split the 3 sections up using:
qplot(x1,x2, color = n3, facets = .~n3)
...and now something similar using GGPLOT2
First thing we need to do is create a dataframe from the four identical length vectors.
df <- data.frame(x1,x2,x3,n3)
colnames(df) <- c("x1","x2","x3","n3")
Some Charting:
g1 <- ggplot(df,aes(x1,x2))
p <- g1 + geom_point(aes(colour=n3), size =3.5) +
          geom_smooth(method = "lm") +
          theme_bw()
print(p)
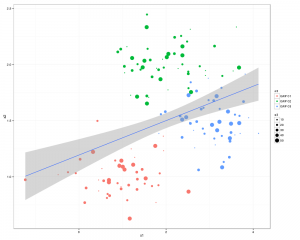
..and a slightly better looking version:
g1 <- ggplot(df,aes(x1,x2))
p  <- g1 + geom_point(aes(colour=n3, size =x3)) +
           geom_smooth(method = "lm") +
           theme_bw()
print(p)
There you go all good stuff.
Other things to check out: facet_wrap
Some more pretty graphics
Some basic Linux commands
Ownership and access permissions for /var/www
chown -R mike:mike /var/www/
chmod -R 755 /var/www/
Simple Java Insertion Sort
package insertionshort;
public class InsertionShort {
    public static void main(String[] args) {
        int[] a = {123, 235, 23, 46, 34, 2, 45, 235, 25, 65, 46, 2345, 25, 246, 24, 5246, 24, 6};
        intInsertionSort(a);
    }
    public static void intInsertionSort(int[] a)
    {
        for (int i = 0; i < a.length; i++) {
            int temp = a[i];
            int j;
            for (j = i - 1; j >= 0 && temp < a[j]; j--)
            {
                a[j + 1] = a[j];
            }
            a[j + 1] = temp;
            for (int f = 0; f < a.length; f++)
            {
                System.out.print(a[f] + "\t");
            }
            System.out.println();
        }
    }
}
create a vector of dates in R Cran
dt <- as.Date('2010-01-01')
dts <- seq(dt,length =17, by="+1 month")
Data Visualisation and Analysis
R
d3js
NodeBox
Python
Raphael
Many Eyes
Processing
GDELT data into ms-sql
Go…here
download the historical backfiles
Use the following script to create a database in the required location:
CREATE TABLE GDELT_HISTORICAL (
 GLOBALEVENTID bigint , --1
 SQLDATE int,
 MonthYear char(6) ,
 [Year] char(4) ,
 FractionDate decimal , --5
 Actor1Code char(55) ,
 Actor1Name char(255) ,
 Actor1CountryCode char(55) ,
 Actor1KnownGroupCode char(55) ,
 Actor1EthnicCode char(55) , --10
 Actor1Religion1Code char(55) ,
 Actor1Religion2Code char(55) ,
 Actor1Type1Code char(55) ,
 Actor1Type2Code char(55) ,
 Actor1Type3Code char(55) ,
 Actor2Code char(55) , --16
 Actor2Name char(255) ,
 Actor2CountryCode char(55) ,
 Actor2KnownGroupCode char(55) ,
 Actor2EthnicCode char(55) ,
 Actor2Religion1Code char(55) ,
 Actor2Religion2Code char(55) ,
 Actor2Type1Code char(55) ,
 Actor2Type2Code char(55) ,
 Actor2Type3Code char(55) ,
 IsRootEvent int ,
 EventCode char(4) ,
 EventBaseCode char(4) ,
 EventRootCode char(4) ,
 QuadClass int ,
 GoldsteinScale decimal ,
 NumMentions int ,
 NumSources int ,
 NumArticles int ,
 AvgTone decimal ,
 Actor1Geo_Type int  ,
 Actor1Geo_FullName char(255) ,
 Actor1Geo_CountryCode char(2) ,
 Actor1Geo_ADM1Code char(4) ,
 Actor1Geo_Lat float ,
 Actor1Geo_Long float ,
 Actor1Geo_FeatureID int  ,
 Actor2Geo_Type int  ,
 Actor2Geo_FullName char(255) ,
 Actor2Geo_CountryCode char(2) ,
 Actor2Geo_ADM1Code char(4) ,
 Actor2Geo_Lat float ,
 Actor2Geo_Long float ,
 Actor2Geo_FeatureID int  ,
 ActionGeo_Type int  ,
 ActionGeo_FullName char(255) ,
 ActionGeo_CountryCode char(2) ,
 ActionGeo_ADM1Code char(4) ,
 ActionGeo_Lat float ,
 ActionGeo_Long float ,
 ActionGeo_FeatureID float  ,
 DATEADDED int
);
Unzip all your history files into one location and then run this script for each file:
  BULK INSERT GDELT_HISTORICAL
    FROM 'C:\Users\MONKEYMIKE\Desktop\201302.csv'
    WITH
        (
		FIELDTERMINATOR = '\t'
		, ROWTERMINATOR = '0x0a'--'\n'
		 )


